Workflow and standard work.
Process boundaries, sequence, variants, decision logic, exception paths, and alignment between intended and actual execution.
01 / Services / Operational Effectiveness Audit
A senior-led, evidence-based assessment of how the organization actually performs across process, people, handoffs, systems, capacity, quality, controls, measurement, and management response.
Organizations rarely lose effectiveness in one dramatic event. They accumulate distance — between policy and practice, ownership and action, demand and capacity, measurement and truth. This audit makes that distance visible.
Operational Effectiveness Audit / Starting at $7,500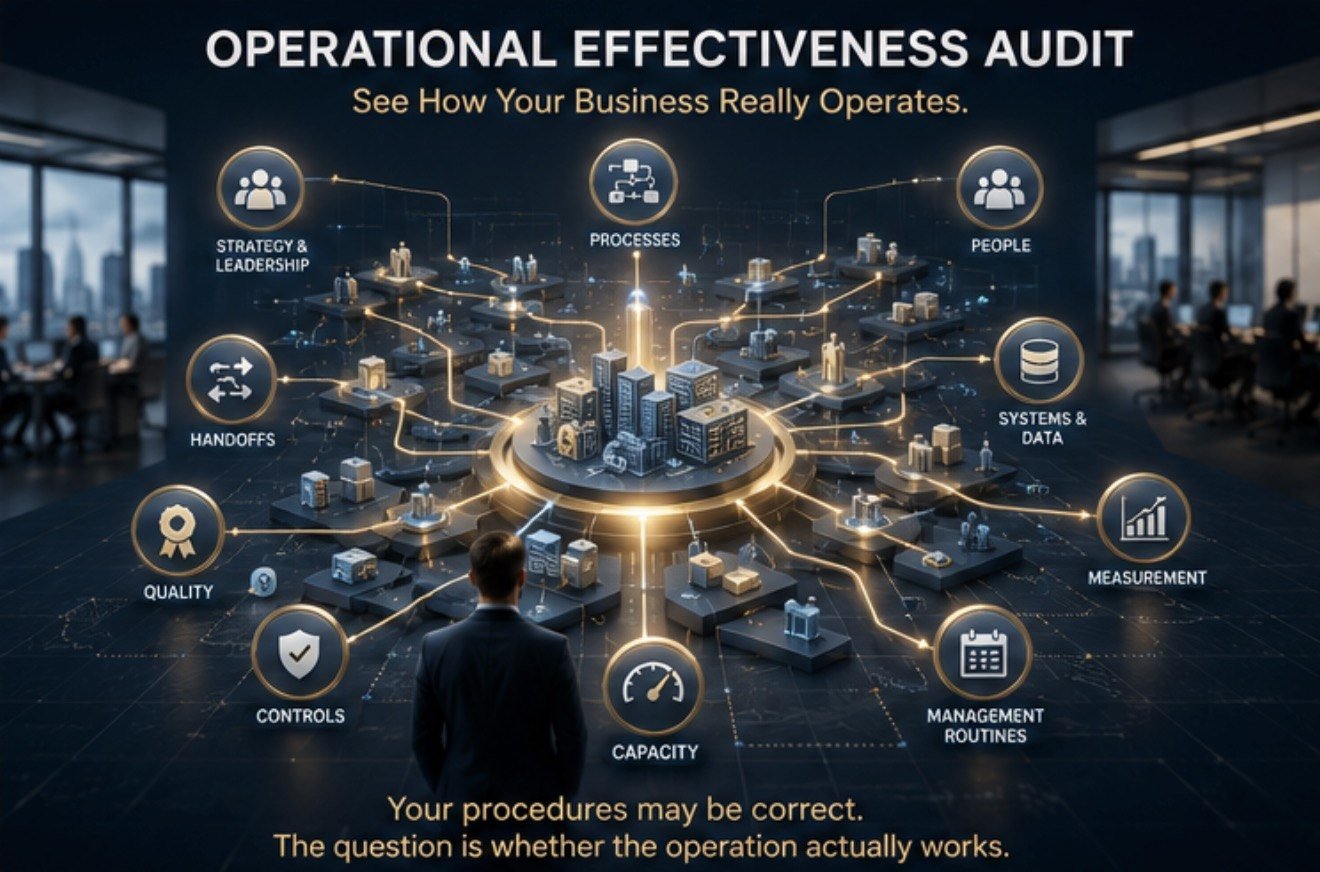
02 / The premise
The objective is not a consultant's collection of opinions. It is a traceable picture of what is working, what is not, what is costing the organization capacity or reliability, and what should happen next.
03 / Operating signals
04 / The operating question
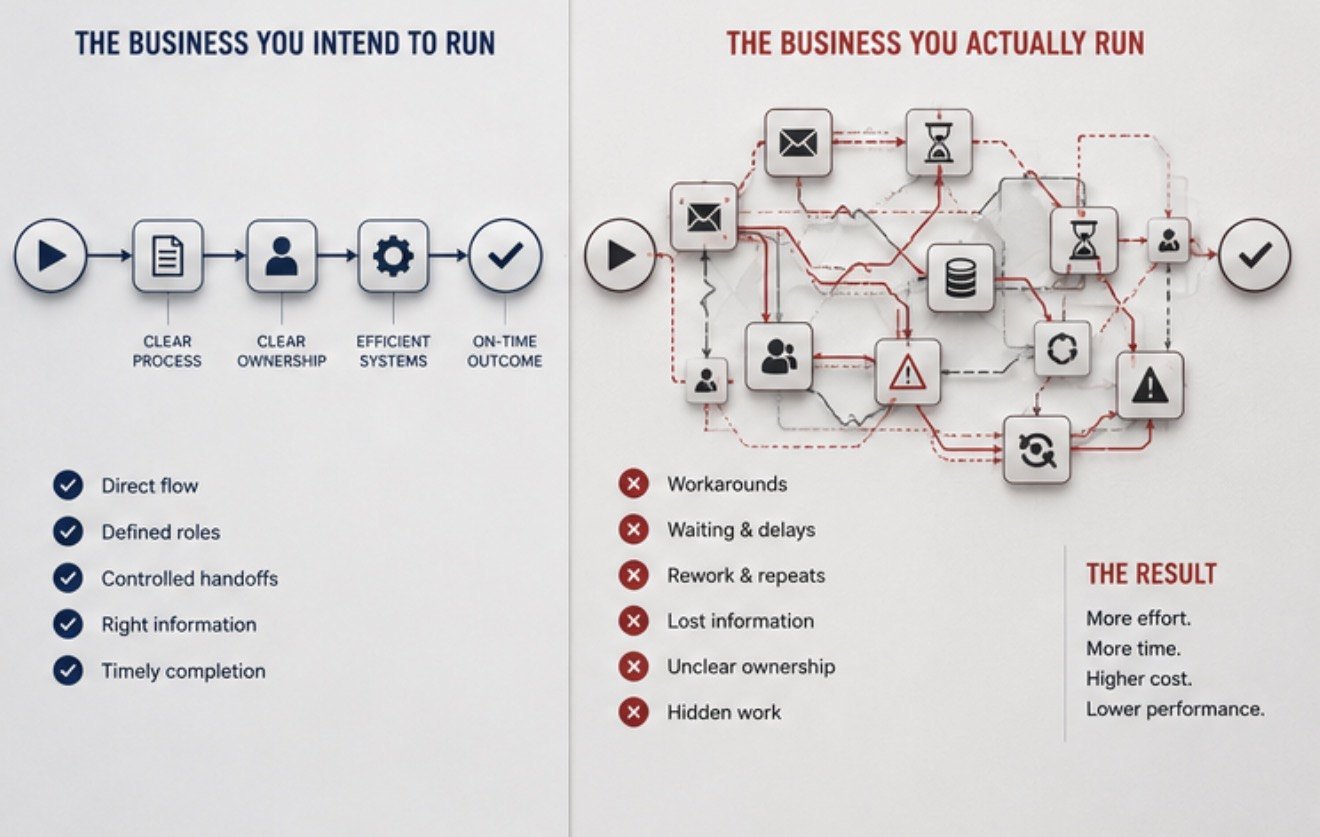
Leadership sees the intended organization: roles, policies, systems, controls, targets, and meeting cadences. Employees experience the enacted organization — the real sequence of work, the actual waits, the informal authorities, the information they cannot obtain, and the exceptions they must absorb.
An operation can have correct procedures, busy people, modern software, and a full calendar while still losing capacity, quality, time, and trust. The failure often lives between departments, inside handoffs, in rework, or in decisions made without reliable operating information.
This audit follows selected work from trigger to outcome and examines the operating system around it: who owns the decision, where work waits, what information is missing, which system is authoritative, what happens when normal stops, and whether leadership can see the condition clearly enough to act.
05 / Failure demand
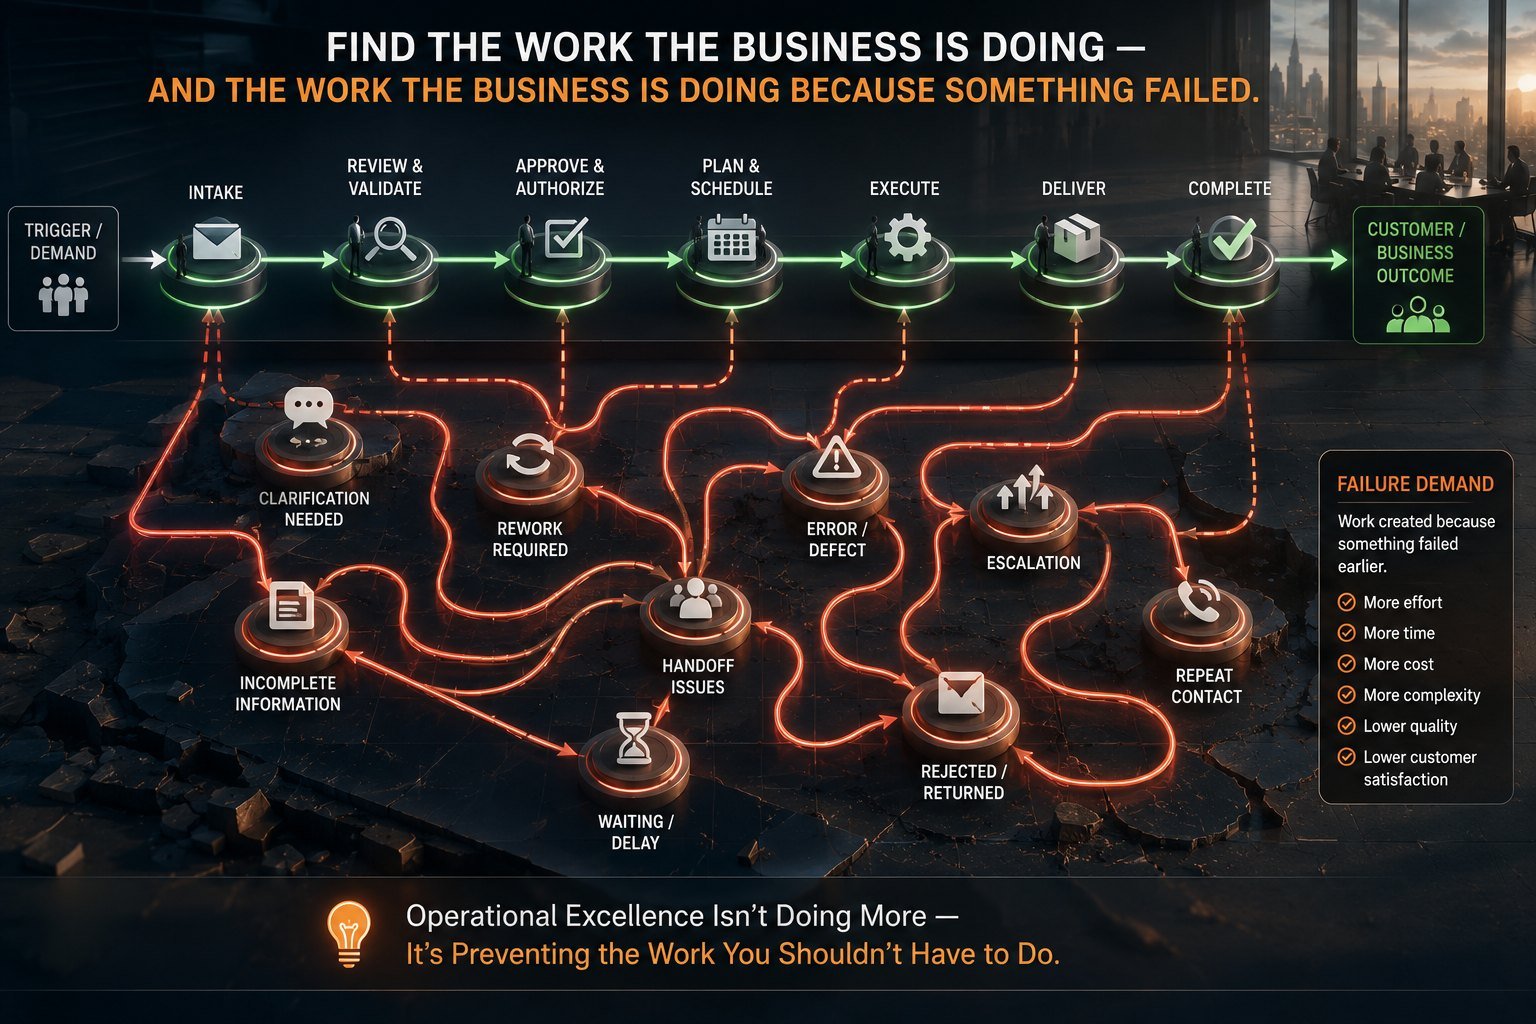
Some of the work moving through your operation right now exists only because something failed earlier. A clarification that should not have been needed. A rejection that returns work already paid for. An escalation that exists because authority was unclear. Counted as new demand, this activity looks like a busy, productive operation.
06 / Nine operating lenses
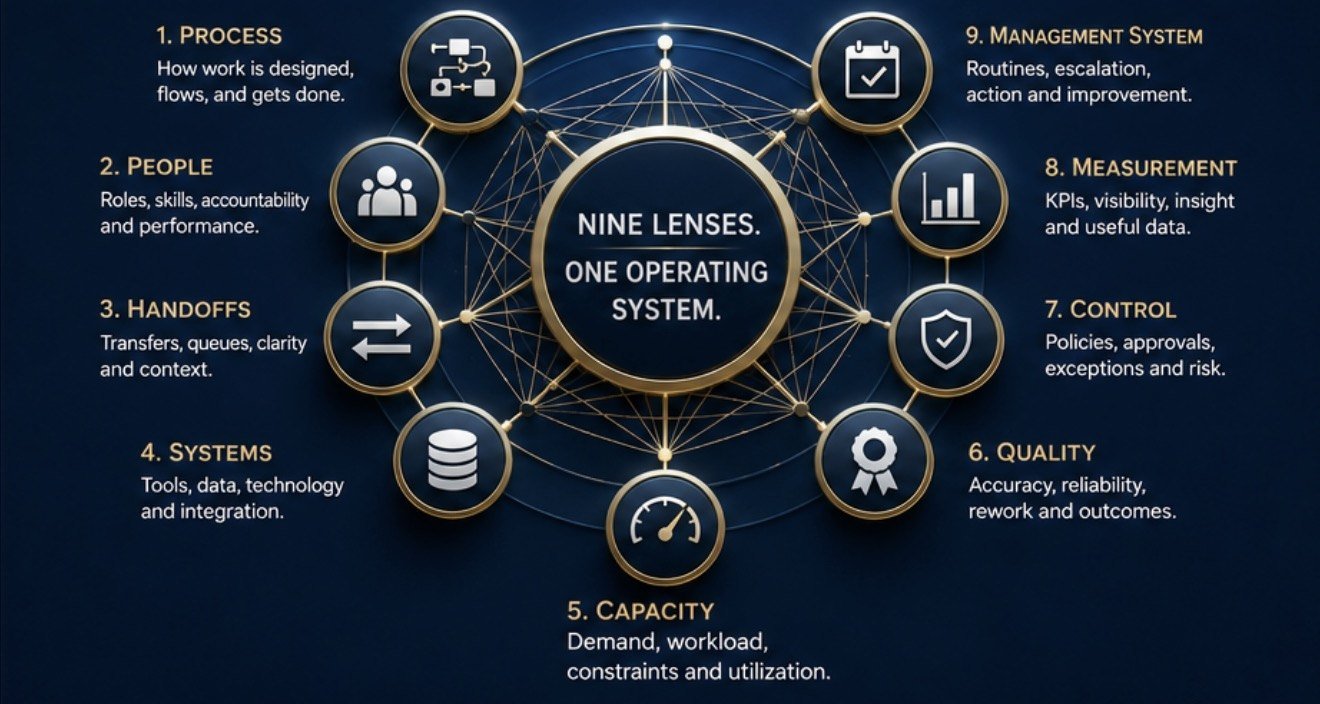
A capacity problem may be a queue design problem. A technology problem may be a process decision that was never made. A KPI problem may be a management-response problem. Treating the visible symptom can preserve the structure that keeps producing it — so every finding is connected back to the system around it.
Process boundaries, sequence, variants, decision logic, exception paths, and alignment between intended and actual execution.
Ownership, authority, staffing, competence, cross-training, escalation, key-person dependency, and accountability.
Movement of work and information between roles, departments, systems, locations, or external parties.
Systems of record, manual re-entry, duplicate tools, disconnected data, workarounds, and automation opportunity.
Workload, staffing relationships, bottlenecks, batching, utilization pressure, scheduling, and constraint behavior.
Errors, retries, corrections, repeat contacts, defects, rejected work, and activity caused by first-pass failure.
Approvals, checkpoints, exception authority, evidence, corrective action, recurring failures, and control performance.
Measures used to run the operation, data reliability, metric ownership, and whether measures drive useful action.
Review routines, escalation, action ownership, issue closure, planning, change management, and decision cadence.
07 / Evidence before recommendation
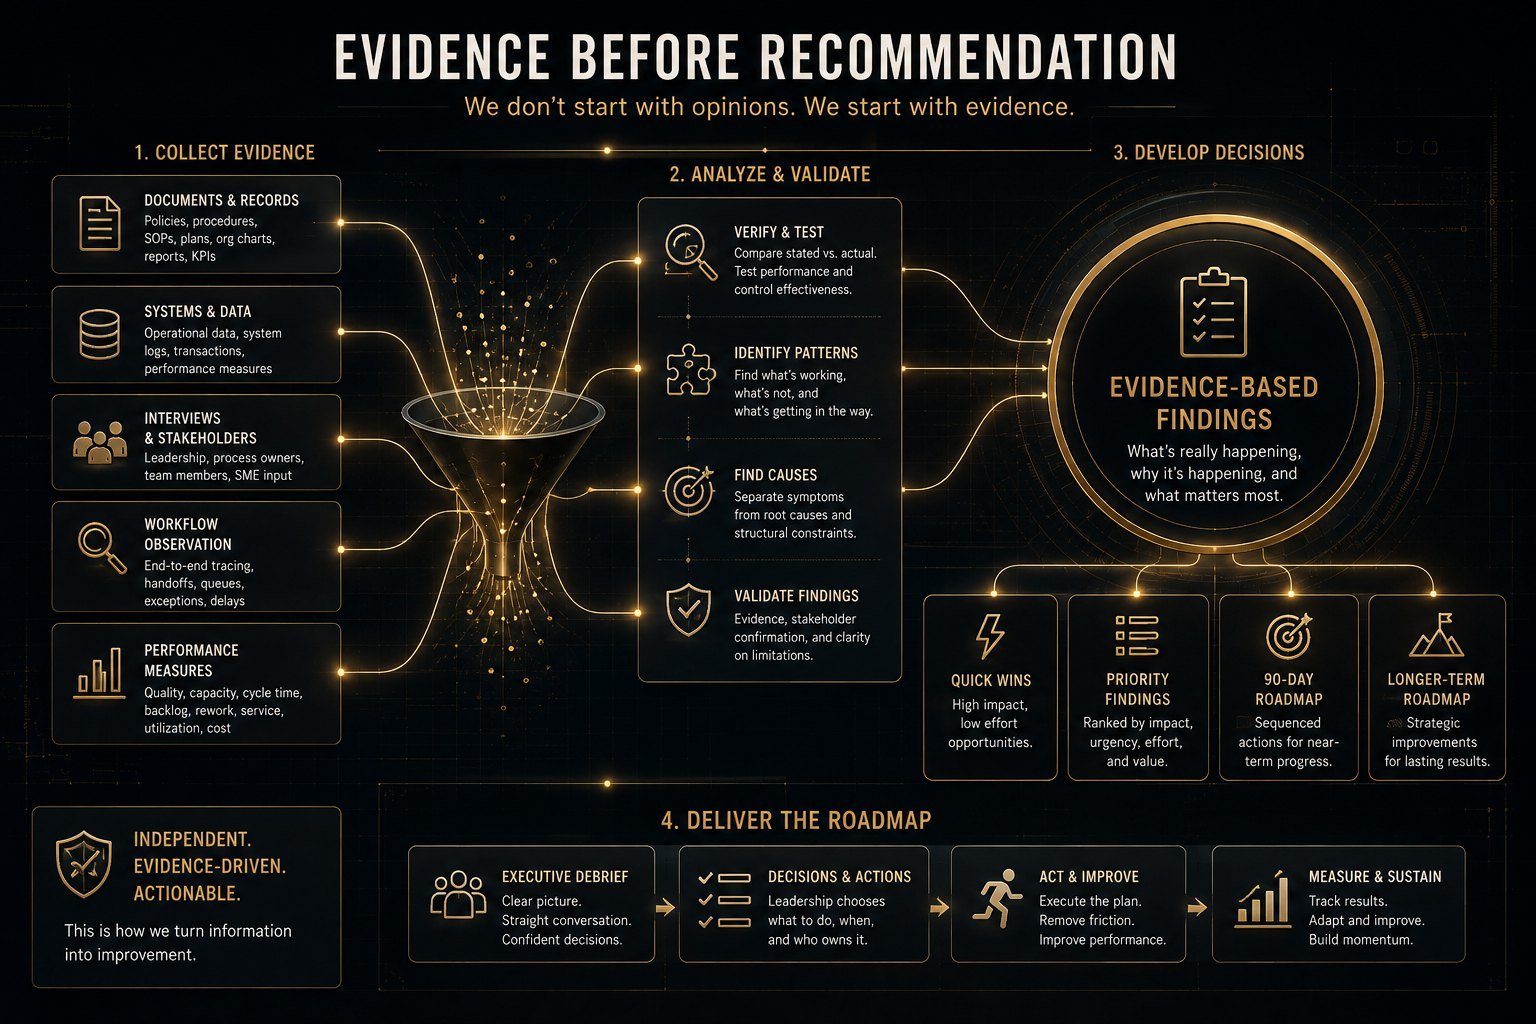
Stakeholder experience matters, but interview volume does not make a finding true. Documents matter, but documented intent does not prove operating consistency. Data matters, but a dashboard is only as useful as its definitions, coverage, and connection to work. The audit uses the available evidence collectively, identifies limitations, tests contradictions, and keeps major findings traceable to the basis for the conclusion.
08 / The deliverable
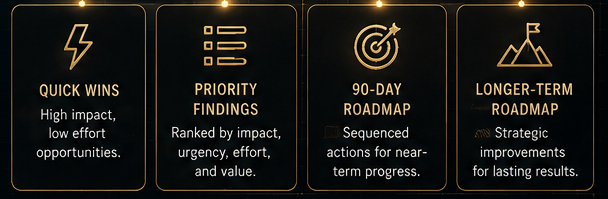
Deliverables are shaped to the defined scope and available evidence. Leadership receives an operating view it can use — not a pile of observations.

09 / Measured where evidence permits
Metrics are selected for the operation rather than forced into a generic scorecard. Where reliable data exists, the audit establishes baselines and connects findings to evidence. Where reliable data does not exist, the absence or weakness of measurement is itself documented as a finding.
Cycle time, queue time, backlog, throughput, work-in-process, and the points where work stops moving.
Errors, rejects, repeat demand, completion quality, correction loops, and the cost of first-pass failure.
Demand, staffing, schedule adherence, workload distribution, utilization pressure, and capacity mismatch.
Exceptions, findings, closure, recurrence, evidence quality, and whether management response changes the condition.
10 / The evidence base
The system view this audit takes — processes as interacting activities, examined alongside measures, risk, controls, and management response — is the position taken by recognized public standards bodies. We cite them because you can check them.
// These are public reference standards that inform the method. JLS does not claim certification by, accreditation from, or benchmarking access through any of these bodies.
11 / Service ladder
Process redesign, broad SOP construction, technology implementation, training programs, and ongoing operational management are separate scopes unless explicitly included.
12 / Clear boundaries
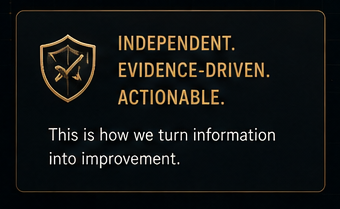
The purpose is not to produce a dramatic list of faults. It is to give leadership a defensible view of current state, structural causes, priorities, and decisions — independence without theater.
The audit identifies supported conditions and improvement opportunities. It does not guarantee savings, performance improvement, regulatory acceptance, or a particular business result.
The audit gives leadership a diagnosis and roadmap. Redesign, documentation builds, implementation, training, and ongoing management can be separately scoped when needed.
13 / The investment
The starting point reflects a defined audit across workflow, people, systems, handoffs, capacity, quality, controls, measurement, and management routines. Scope varies with functions, locations, workflow count, evidence volume, systems, process variants, field observation, complexity, and reporting depth.
// SENIOR-LED / EVIDENCE-BASED / INDEPENDENT OF IMPLEMENTATION
14 / Common questions
No. It is an independent operational consulting assessment. It does not replace a CPA financial audit, regulator, certification body, insurer, attorney, or other specialist review.
No. The engagement identifies supported improvement opportunities and can quantify impact where reliable evidence allows. Results depend on implementation and operating conditions.
A process map may show the approved route. It may not show the queue before the handoff, the spreadsheet used to repair the system, the work returned for clarification, the manager who must approve every exception, or the metric that looks healthy because failure demand is counted as new work. This audit tests intended operation against operating reality.
No. Effectiveness is treated as a system property. A slow team may be receiving unstable inputs; a quality problem may begin in unclear ownership. Findings are connected to structure, not to individuals.
Not unless explicitly contracted. The audit gives leadership the diagnosis, priorities, and roadmap. Implementation work can be scoped separately.
Yes. A tightly bounded function may be quoted below a broad enterprise engagement when the scope genuinely requires less discovery and analysis.
15 / The decision
Bring the workflow, the data, the people, the systems, and the question leadership needs answered.
Start the conversation →Starting at $7,500 Senior-led audit
Talk to us